Trendlines
Trendlines
The trend is my friend
Trendlines can be drawn from highs to highs and lows to lows, with the more candles touching; the stronger the signal. Using trendlines to connect price action sometimes makes familiar forms or shapes known to technical analysts as price patterns. Price patterns can be seen on all timeframes and usually, the longer the timeframe - the longer it can take to develop and break through that pattern. A “breakthrough signal” is used to enter long on a position when breaking through a resistance point where you expect price to rise, or to enter short when breaking support and you’re betting on the stock price falling.
***Buying an options call is the same as going long when you are bullish, and buying a puts option is the same as shorting a stock when you expect it to fall***
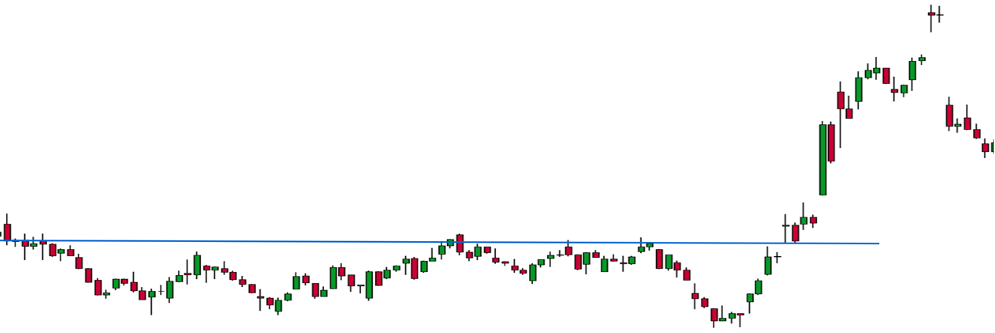
Using the above example, where the blue line is a key resistance level (touched more than three times and fell), a good entry would be above the blue line. Once the stock price broke through the resistance line for a third time near the end, the price came down once more (retest) then continued on its way up. If another line was drawn through the bottom of the lows this would have shown a short-term consolidation. The target for a consolidation breakthrough is the difference in the range from top to bottom of the channels, added to where the price has broken through. The same is the case for bear/bull flags.
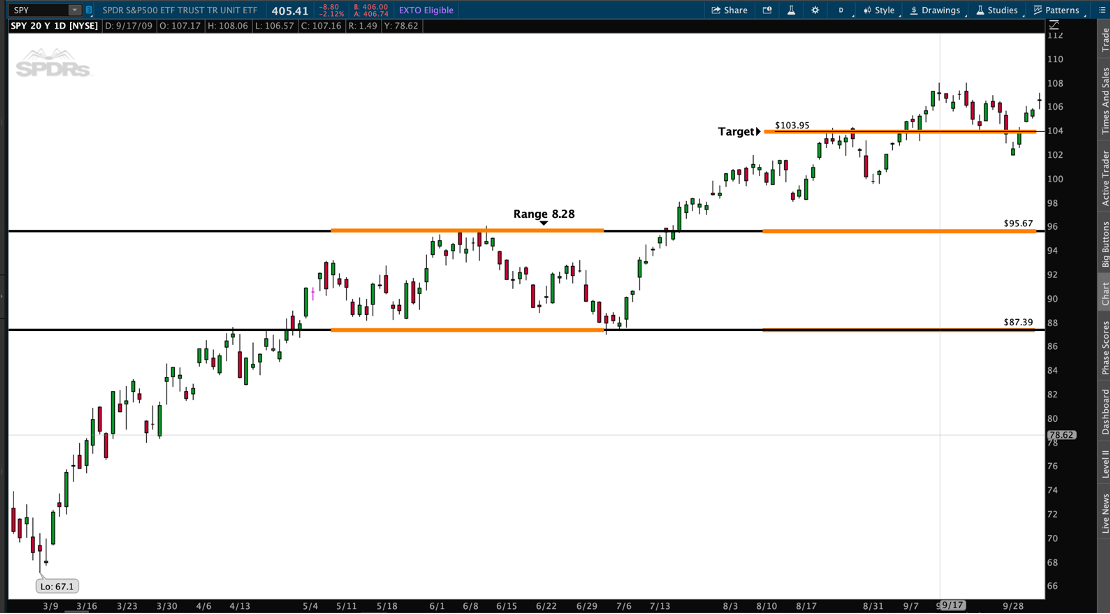
Below we see the S&P 500 ETF (SPY) climbing out of a 20-year low in in March, 2009 in an uptrend using a Daily Chart, then began consolidating between $87.39 and $95.67. The difference in these prices then added to the top channel creates my first target: $95.67 - $87.39 = $8.28 that is my range, then $95.67 + $8.28 = $103.95 would’ve been my target, which was hit later mid-August. SPY kept on moving up in this uptrend for many more days to come, currently at $405.41 on May 13, 2021!